


Views: 0 Author: Site Editor Publish Time: 2026-11-09 Origin: Site


A truck may leave the yard with a full hopper and a familiar controller setting, yet apply a different amount of salt after a material delivery or a repair. The operator sees the same number on the panel. The road sees whatever the machine actually discharges at the truck's speed. Calibrating a truck salt spreader connects those two numbers. The result should be a setting chart that another operator can use and verify, with the truck, material, and test conditions identified. Start by measuring feed output, then check whether the spinner places that output where the route calls for it.
There are three values worth tracking. The first is the controller setting, which is the command to the equipment. The second is the discharge rate, or the weight of salt leaving the feed system per minute. The third is the application rate, which describes how much material is applied to a length or area of roadway. A dial number alone tells a supervisor very little about either of the last two.
For a manual system, a steady feed rate is spread over more road as the truck speeds up. If the operator slows down and the feed rate stays the same, more material is applied per mile. A ground-speed-controlled system attempts to compensate by changing the feed as vehicle speed changes. A display that claims to make that adjustment still needs a check. Its output depends on a usable speed signal, the controller's configuration, and the actual response of the feed mechanism.
Define the denominator before testing. Some programs work in pounds per treated lane mile, while others use weight per unit area. If a route log records road miles and a truck treats two lanes at once, the two distance figures serve different purposes. The controller may also use a different convention from the route sheet. Record what the agency means by its target unit, including how it counts treated lanes, before converting a measured result.
Feed and pattern answer different questions. A collection test can establish that a machine discharges the intended mass. A pattern check asks whether that mass stays within the intended treatment width and whether the coverage is balanced. A spinner change may shift the material sideways without materially changing the discharge weight. Keep the two tests separate so the correction matches the problem.
Give each record a truck ID, spreader ID, controller type, material description, and date. Identify the batch or delivery if possible. Wet or caked salt can feed differently from dry granular salt, and a different material can have a different bulk density or flow behavior. A chart labeled only “salt” loses much of its value when the next delivery looks and behaves differently.
For fleets comparing truck-mounted salt spreaders, identify the feed and spinner controls before assigning a test procedure. A manual controller, an automatic controller, and a controller with a simulated-speed mode may require different procedures. Follow the instructions for the actual installation. Verify that the controls, speed signal where applicable, and feed components are in serviceable condition before treating a test result as a calibration value.
Set up the test with a stable collection container and a scale suitable for the expected sample weight. Record the container tare and use the same timing convention for every run. Keep the feed path in the approved test configuration. Salt held in a chute before a timed run, or material that continues falling after the interval, can distort a short sample. Agree on the start and stop points before the first reading.
| Record before the test | Why it matters |
|---|---|
| Truck, spreader, and controller ID | Keeps settings tied to one installation |
| Material and condition | Makes differences between salt deliveries traceable |
| Collection interval and scale tare | Makes repeated weights comparable |
| Actual or simulated speed | Gives the calculation its distance basis |
| Treated width or number of lanes | Clarifies the application-rate denominator |
| Gate and feed configuration | Preserves the setup needed to reproduce the output |
Use the approved stationary collection setup, with access to moving parts controlled and the collection container handled only when the equipment is in the condition required by the manual. For a manual feed control, choose the normal settings that matter on your routes and measure discharge at each. For a controller with simulated speed, enter and document the test condition in the approved mode. A controller that needs a different calibration sequence should be checked using that sequence.
Weigh the collected material, subtract the tare, and divide by the measured collection time to obtain the flow. Take repeat samples at the same setting. When the results differ enough to affect a route decision, investigate before averaging them. A variable material feed, an inconsistent collection interval, or a change in hopper condition can produce more scatter than the difference between adjacent settings.
A simple one-lane example makes the conversion clear. Suppose a repeatable test measures 50 pounds in one minute, and the route speed used for the check is 25 mph. At that speed, the truck travels 25 ÷ 60 miles in one minute. Dividing 50 pounds by that distance gives 120 pounds per treated mile. If exactly one lane is treated along that mile, the numerical result is also 120 pounds per lane mile. These values illustrate the calculation. Set the target rate from the applicable route and material policy.
For an automatic controller, compare the actual discharge with the rate expected at the simulated or measured speed under its approved procedure. Check more than one operating point. A controller that agrees near the middle of the working range may still behave differently at a low feed setting. Record actual readings beside displayed readings so a supervisor can see where the discrepancy begins.
On a pickup truck salt spreader with adjustable feed, use the collection results to decide which setting should be retested. If two adjacent settings yield nearly identical results, check whether the feed has reached a practical limit or whether the material is bridging before assuming the control scale is linear. After the feed check, verify the pattern under the fleet's approved procedure and record the spinner or deflector configuration separately.

A useful chart is a short operating record. Each row should carry the material, test speed, feed setting, repeat sample weights, calculated road rate, and pattern setting where relevant. Add the calibration date and keep the underlying test readings. A rounded number on a cab card is easy to use, but the original numbers help a technician reproduce a test after a repair.
Give operators the range of settings the fleet actually validated. Interpolation can help select a setting to test, but a guessed value should not enter the chart as a measured result. If a new target falls outside the tested range, run another check. Compare its discharge and pattern against the route's requirements before assigning it to a crew.
When a truck returns from service, consider which part of the system changed. A repair to the feed drive can alter the discharge response. Replacing or repositioning a spinner component can alter distribution. A new speed signal or controller configuration can affect the relationship between speed and feed. A polyethylene de-icing spreader may share the same general calibration logic as other truck-mounted units, but its chart should follow the particular truck, controller, and material it was tested with.

| Field observation | First check |
|---|---|
| Correct collected weight, salt falls short of the target width | Check the spinner, deflector, and test conditions |
| Output differs at the same setting after a new delivery | Check material condition and repeat the collection test |
| Manual unit applies heavily on slow segments | Compare route speed with the chart's tested speed |
| Automatic system disagrees with the test at several speeds | Verify the speed input and controller configuration |
| Repeated samples at one setting vary substantially | Check for inconsistent feed, collection, or timing |
A route supervisor can also use the log to plan for speed changes. For a manual controller, calculate what the same measured discharge would do at the slower speed expected on turns or narrow segments. That comparison can identify a second setting to test. For a speed-controlled unit, keep separate records for command changes and measured changes. If the displayed speed is steady while the truck speed signal is unstable, resolving that discrepancy is more useful than adjusting the feed chart around a faulty input.
A pre-season check gives the fleet a baseline. Repeat a relevant test after changes to the material, controller, feed equipment, or spread pattern, and whenever field results no longer match the recorded output. Keep the calibration log with the machine's service history. A comparison between the current and previous test often reveals whether the change came from the salt, the truck, or the measurement setup.
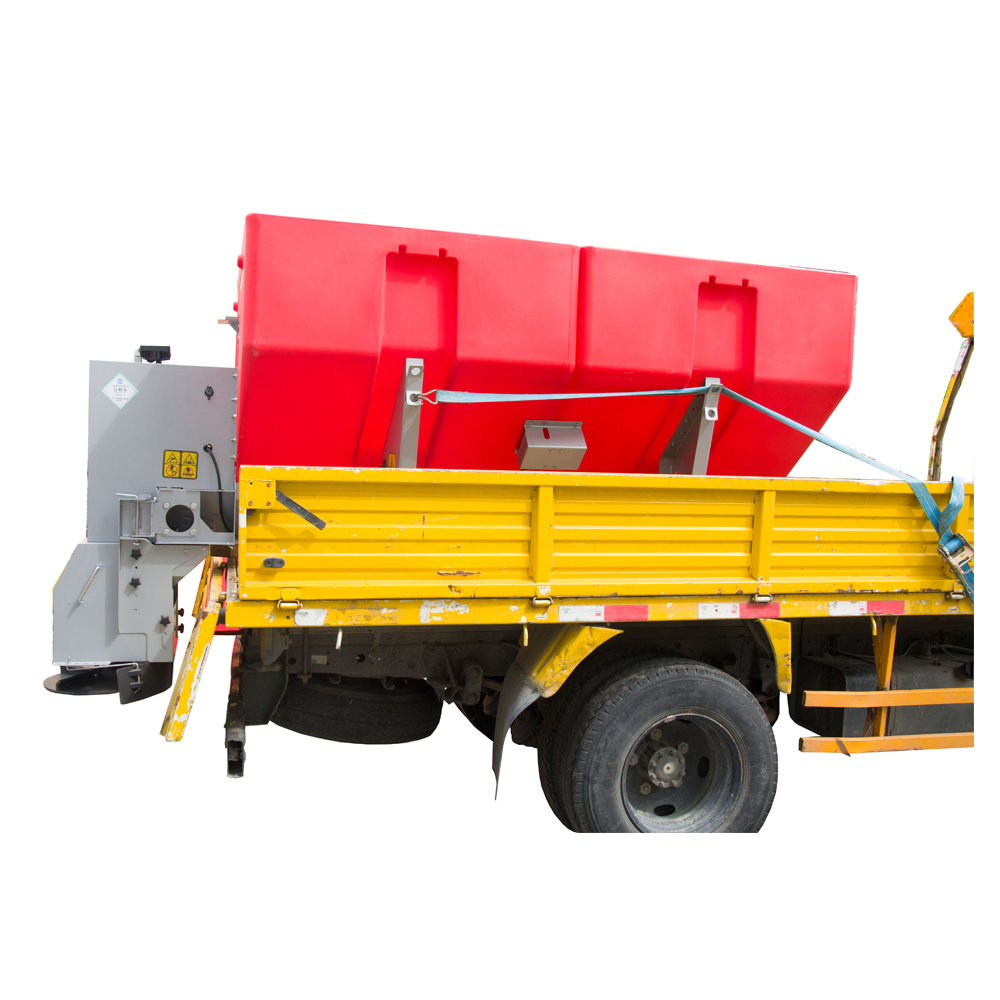
Calibrate a truck salt spreader around the material and operating range the crew will actually use. Treat the collected weight as the basis for a rate calculation and use a separate pattern check to verify where the salt lands. The most useful result is a record a second operator can reproduce, with a clear basis for revisiting it after a material or equipment change. When reviewing equipment from Fanuode, a road maintenance equipment company, include the controller type, approved test method, and how the settings will be logged alongside hopper and mounting requirements.
Use a shared template, then establish readings for each installation. Even similar hardware can respond differently when the controller, speed input, gate setting, or feed condition differs. Two vehicles can share operating values after the fleet verifies that their measured behavior agrees under the same test conditions.
Use the load condition specified by the equipment procedure and record it. The material should feed steadily during the test. If a fleet is investigating an output problem that occurs near an empty hopper, it can record a separate check under approved conditions and keep that result distinct from the normal baseline.
Inventory can flag a discrepancy. Compare the expected usage from treated lane miles with the amount issued and returned. Loading differences, changes in route coverage, and residual salt in the hopper can also change the total. A controlled collection test can help isolate the cause.
Keep the old chart with its material label and create a new set of readings for the replacement. Compare the two under the same approved setup and test conditions. Maintain separate entries when they require different settings to reach the same route target.
The weights show how consistent the test was. They help diagnose a later change in discharge and make it possible to check a conversion without repeating the entire session. A final setting by itself hides both the calculation and the variation between runs.


